 (METV)")
We Are
The shine has come off once-high-flying tech stocks in recent months. The Information Technology sector is barely outperforming Treasury bills thus far in 2024 while other sectors such as Energy and Utilities have performed well in the last month. It comes as the macro backdrop turns murkier, with recalcitrant inflation fears and concerns that steeper interest rates, now approaching 5%, could damage the Goldilocks soft-landing outcome.
Just a few days ago, the monthly Bank of America Global Fund Manager Survey revealed that an increasing percentage of portfolio managers believe a “no landing” scenario is in play. So, if that sanguine view is jeopardized, further volatility could be in store.
I am downgrading the Roundhill Ball Metaverse ETF (NYSEARCA:METV) from a buy to a hold based on the expectation for a further market correction, which would likely impact METV’s biggest holdings.
Energy & Utilities Take the Shine From Info Tech in 2024
Seeking Alpha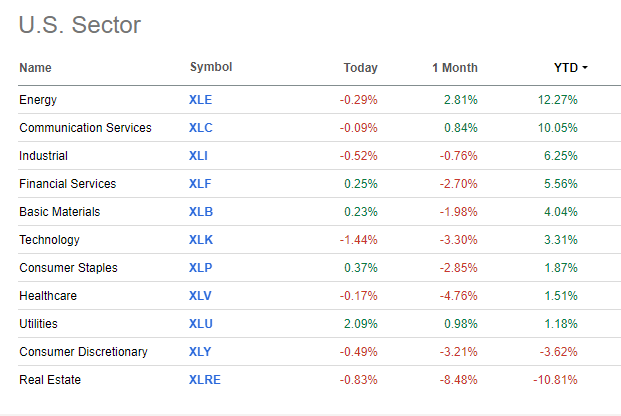
Global Portfolio Managers Turning Too Optimistic?
BofA Global Research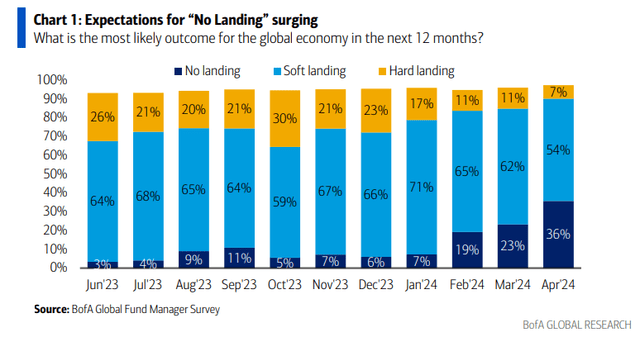
According to Seeking Alpha, METV invests in stocks of companies operating across information technology, software and services, IT services, data processing and outsourced services, internet merchant services, payment service providers and gateways, payment wallets, internet services and infrastructure, infrastructure services, networking services, technology hardware and equipment, and metaverse sectors. Roundhill notes that METV is the first index globally designed to track the performance of the Metaverse. The Index consists of a tiered weight portfolio of globally listed companies that are actively involved in the Metaverse.
Despite a solid 15% advance since I last reported on the ETF, METV’s assets under management has dropped from $415 million to just $395 million today. It’s evidence that investors are seeking new areas, and not just exposure to the tech trade. Still, the fund’s share-price momentum remains solid with an A- rating from Seeking Alpha – an improvement from three months ago.
METV sports a high annual expense ratio considering its straightforward strategy at 0.59%. Also, the fund’s trailing 12-month dividend yield is low, under 20 basis points as of April 17, 2024. Finally, as you might expect, the fund earns a decent liquidity rating given its average daily volume of more than 230,000 shares and a median 30-day bid/ask spread of eight basis points.
The Bronze-rated ETF by Morningstar plots along the top row of the style box, but there have been some shifts from Q4 2023. First, there is more value exposure today among its large-cap holdings. Second, there has been a notable increase in mid-cap positions. While it may be splitting hairs, METV has undergone a modest amount of diversification. But its price-to-earnings ratio has actually increased by four turns versus my previous analysis, which is not an encouraging sign.
METV: Portfolio & Factor Profiles
Morningstar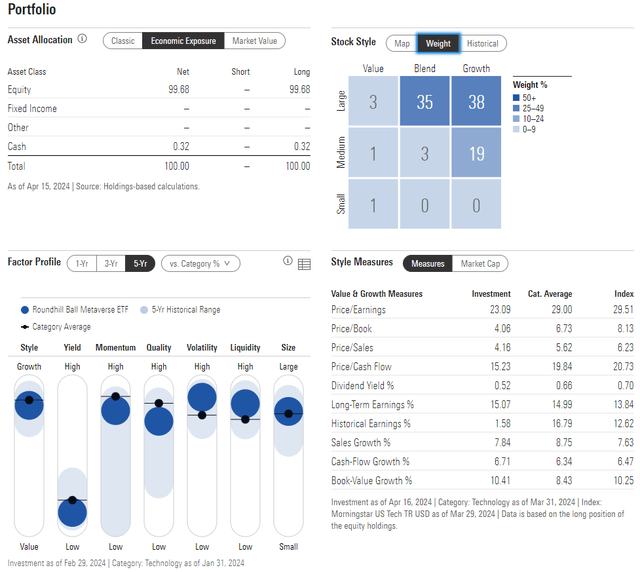
Looking closer at the sector breakdown, METV remains a majority tech-based portfolio. There’s a significant 39% weight in the Communication Services sector too.
Apple (AAPL) has recently supplanted Roblox (RBLX) as the largest holding, but the rest of the top 10 positions are comparable to what was seen in Q4 2023. Overall, the top 10 assets account for roughly half of the total portfolio, so there is some concentration risk.
METV: Holdings & Dividend Information
Seeking Alpha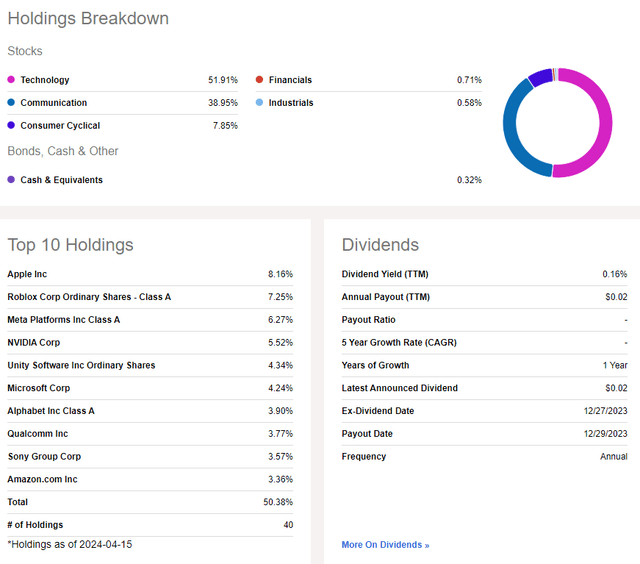
Since METV has been around for less than three years, I decided to look at the seasonal trends of the NASDAQ 100 ETF (QQQ). Typically, QQQ performs well from April through August, so that could indicate that now is a favorable time for a short-term long position in METV.
QQQ Seasonality: Bullish Trends Through August
Seeking Alpha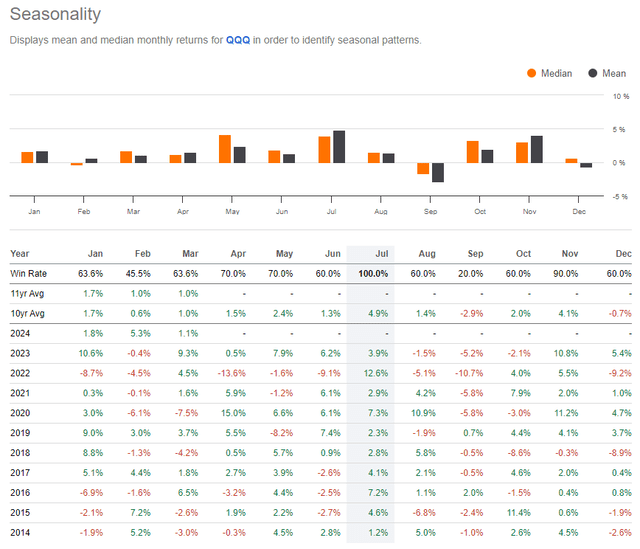
The Technical Take
METV has been on a strong run since late 2022. Notice in the chart below that there is a pronounced uptrend channel that began around the $7 mark and has continued all the way through the first quarter of 2024, with price climbing to near $13 last month, though it has since pulled back to under $12.
Now notice the long-term 200-day moving average. It is positively sloped and comes into play just shy of $11. That’s also where the 38.2% Fibonacci retracement level rests. I’ve highlighted that with the green horizontal line. What’s more, there’s confluence with the lower end of the uptrend channel at that same level, so we could see METV pull back another dollar or so while keeping the long-term uptrend intact.
But take a look at the RSI momentum oscillator at the top of the graph. It is printing a series of lower highs and just recently notched its weakest mark dating back to Q4 of last year. That tells me that the bears have some near-term control of the trend, so a retreat down to the $10.50 to $11.00 range is certainly in play, and that is one of the primary reasons for me downgrading the ETF from a buy to a hold.
Overall, the long-term trend appears higher but there are increasing signs that its pullback is likely to persist as we venture further into the second quarter.
METV: Weakening Momentum, Long-Term Uptrend Intact
Stockcharts.com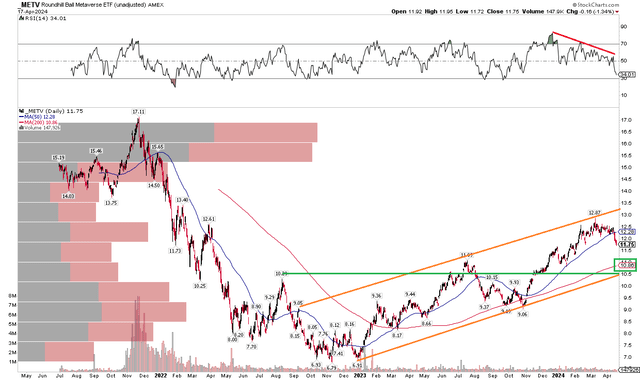
The Bottom Line
I am downgrading METV from a buy to a hold. The valuation has become more expensive, while the technical situation suggests caution.
Credit: Source link