Dogecoin is showing early signs of life after a weeklong downtrend, as new technical signals on the 4-hour Heikin Ashi chart suggest the meme coin may be pivoting toward recovery. The Dogecoin 4-hour candlestick Relative Strength Index (RSI) indicator is flashing oversold conditions and a falling wedge pattern forming at support, creating what might be a setup for a rebound upward.
Price Decline Triggers RSI Drop To Oversold As Red Candles Pile Up
Dogecoin’s price chart has been a sea of red over the last seven days on the 4-hour candlestick timeframe. Since March 27, the popular meme coin has consistently printed red Heikin Ashi candles, with a notable stretch producing as many as seventeen consecutive red closes. This trend came on the heels of a failed attempt by bulls to reclaim the $0.20 level, where Dogecoin briefly spiked before being overwhelmed by sell pressure. The price eventually descended toward the $0.1615 mark at the time crypto analyst Trader Tardigrade shared the analysis.
As this happened, the Relative Strength Index (RSI) on the 4-hour chart swiftly shifted from an overbought zone to deeply oversold, showing the magnitude of the downturn and the extent of bearish dominance during this period.
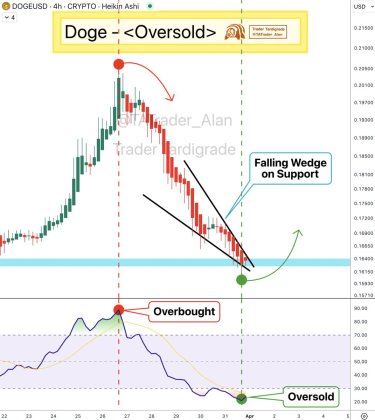
Beyond the RSI’s dip into oversold conditions, the 4-hour Heikin Ashi chart has also revealed a falling wedge pattern developing right at a support zone. Falling wedges are seen as bullish reversal formations, especially when accompanied by oversold momentum indicators like the RSI. The confluence of these two signals suggests that there might be a bounce on the horizon for Dogecoin.
Breakout From Falling Wedge As Green Candles Confirm Momentum Shift
In a follow-up shared by the original analyst, Trader Tardigrade, Dogecoin has begun to flash early signs of a breakout from its falling wedge structure. This shift in momentum is marked by the appearance of three successive green 4-hour Heikin Ashi candles, representing the clearest bullish pattern in this timeframe since the decline began. These developments indicate a possible uptrend continuation, with a short-term rebound now appearing more likely in April.
The bounce signals couldn’t come at a more crucial time for Dogecoin, which just ended the most bearish first quarter it has seen in seven years. Notably, Dogecoin posted a steep 46% loss from January through March, which was its worst Q1 performance since 2018, when it plunged by an even deeper 68.8%. This historical context places added weight on the current price action, as it provides some sort of outlook as to how Dogecoin might trade for the rest of the week.
At the time of writing, Dogecoin is trading at $0.17, up by 4.5% in the past 24 hours.

Featured image from iStock, chart from Tradingview.com

Editorial Process for bitcoinist is centered on delivering thoroughly researched, accurate, and unbiased content. We uphold strict sourcing standards, and each page undergoes diligent review by our team of top technology experts and seasoned editors. This process ensures the integrity, relevance, and value of our content for our readers.
Credit: Source link