The price of Ethereum appeared to be back on its way to recovery, reclaiming the psychological $2,000 level earlier in the week. However, the altcoin was among the crypto assets heavily impacted by the latest inflation data in the United States, returning below $2,000.
This latest correction highlights the struggles of the Ethereum price over the past few months, underperforming even in the midst of a market-wide bull run. Interestingly, a prominent indicator has flashed the imminence of a bottom for the second-largest cryptocurrency.
Is ETH Ready For A Rebound?
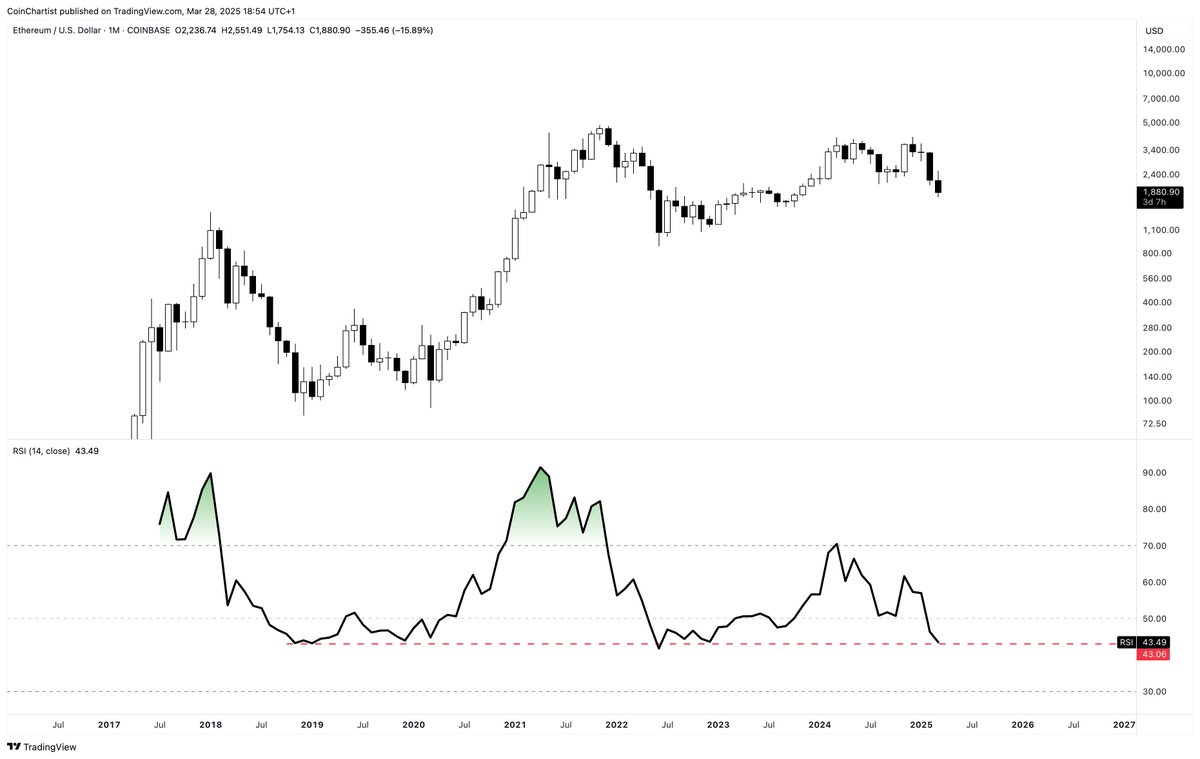
In a March 28 post on the X platform, Chartered Market Technician (CMT) Tony Severino shared that a critical indicator for the Ethereum price is at 2018 bear market levels. The crypto expert suggested that the altcoin could be gearing up for a rebound from its recent lows.
This analysis is based on recent changes in the 1-month relative strength index (RSI) indicator on the Ethereum monthly chart. The relative strength index is a momentum indicator used in technical analysis to measure the speed and magnitude of an asset’s price changes.
The RSI oscillator is used to detect whether an asset is being overbought or oversold, indicating the tendency of a trend/price reversal. Typically, an RSI reading of over 70 signals an overbought market condition, while a relative strength index value below 30 suggests an oversold condition.
According to Severino, the monthly Ethereum RSI indicator is currently at a value last seen during the bear market in 2018. As observed in the chart below, the indicator also reached this bottom following the crypto market capitulation events in May and November 2022.
Source: @tonythebullBTC on X
After reaching this level, the relative strength index and price of ETH tend to bounce back to new highs. In the 2018 cycle, the Ethereum price surged by nearly 4,000% from around $120 to the current all-time high of $4,878.
Meanwhile, the altcoin returned to around this record-high price in early 2024 after reaching this RSI bottom in 2022. If history were to repeat itself, the price of ETH could bounce back from its current point to a new high.
However, Severino highlighted in his post that the monthly Ethereum RSI bottom in 2018 came after the price dropped roughly 94% from its then all-time high. The price of ETH is only 56% adrift from the local high and 63% from its current record high. Hence, it remains to be seen whether the Ethereum price is at risk of further decline.
Ethereum Price At A Glance
As of this writing, the price of ETH is around $1,880, reflecting an almost 7% decline in the past 24 hours.
The price of ETH on the daily timeframe | Source: ETHUSDT chart on TradingView
Featured image from Unsplash, chart from TradingView

Editorial Process for bitcoinist is centered on delivering thoroughly researched, accurate, and unbiased content. We uphold strict sourcing standards, and each page undergoes diligent review by our team of top technology experts and seasoned editors. This process ensures the integrity, relevance, and value of our content for our readers.
Credit: Source link
