Ethereum’s slide to its lowest level in more than a year is testing the Wall Street trade that brought the token deeper into institutional portfolios.
Data from CryptoSlate shows that the second-largest cryptocurrency fell to as low as $1,506 during the last 24 hours, its weakest level since April 2025, extending a broad crypto selloff that has already drained leverage from derivatives markets and pushed traders toward defensive positioning.
Crucially, the downswing is not confined to ETH’s spot market as the digital asset is also experiencing a broader deterioration across regulated ETF flows, centralized exchange deposits, and derivatives positioning.
This situation comes at a time when the broader crypto market sentiment has significantly weakened, with Bitcoin falling toward a four-month low near $60,000, while Ethereum has erased much of its market support.
ETF outflows weaken Ethereum’s institutional bid
The pressure has been most visible in the ETF market, where the products that gave institutions a regulated way to buy Ethereum have turned into a source of persistent outflows.
Data from SoSoValue shows that spot ETH ETFs have recorded four straight weeks of withdrawals totaling more than $870 million.
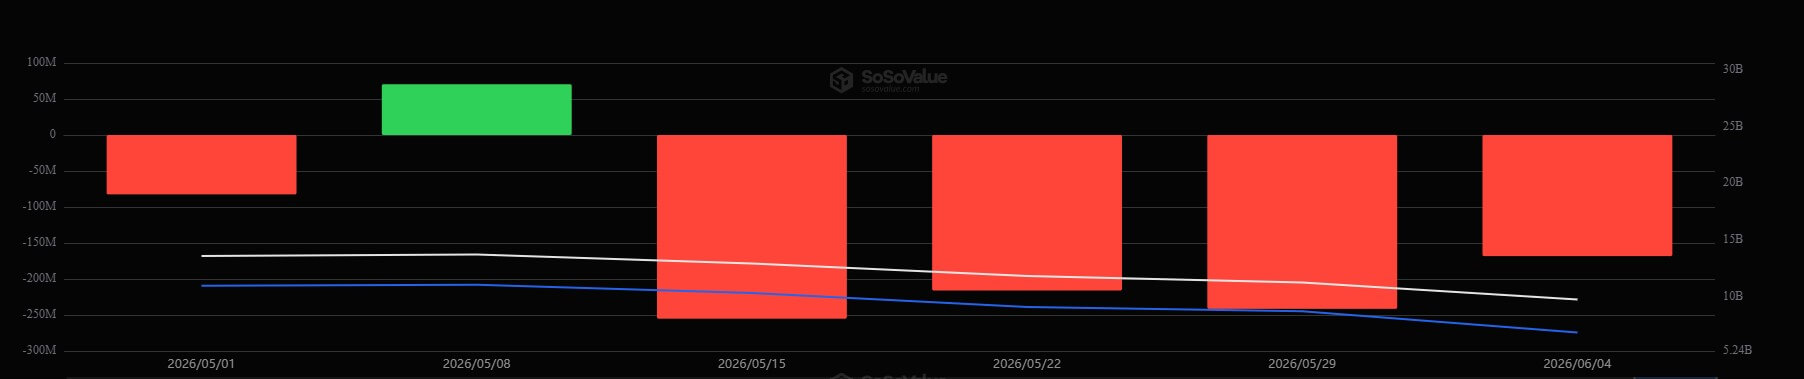
During that period, the funds posted a 17-day outflow streak interrupted by only one day of inflows, when investors added $19.3 million.
As a result, sosoValue data show total spot Ethereum ETF assets have declined more than 70% from their $30 billion peak to $8.71 billion, which is equal to about 4.01% of Ethereum’s circulating market capitalization.
The reversal has weakened one of the main arguments behind Ethereum’s institutional expansion. The ETFs were expected to broaden access to the asset, deepen liquidity, and give traditional investors a cleaner way to gain exposure without handling tokens directly.
However, that demand has softened as ETH’s price moved lower and investors have reduced risk across digital assets.
Exchange inflows add another supply risk
As institutional demand-side forces abated, the physical supply available on liquid trading platforms experienced a sudden and substantial expansion.
CryptoQuant data show Ethereum inflows to trading platforms climbed to about 2.24 million ETH in a single day, the highest level in four months. Binance accounted for more than 1.16 million ETH of those inflows, representing more than half of the total.
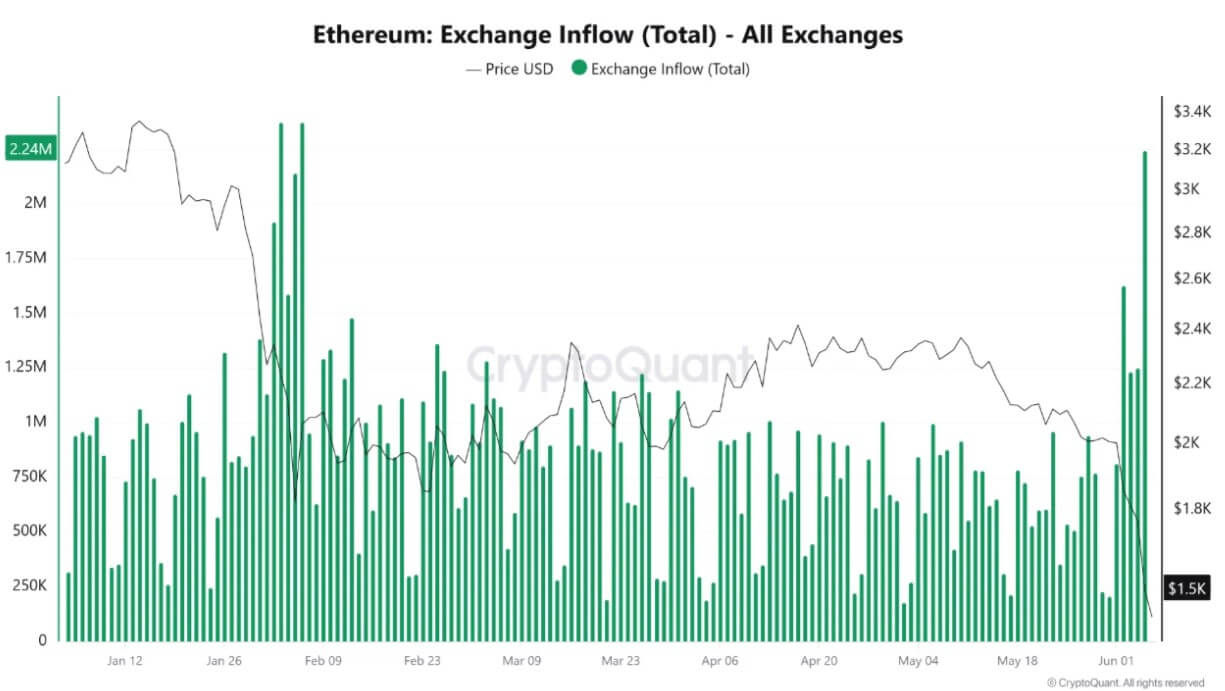
This surge in active supply can be seen in high-profile on-chain movements that served as glaring evidence of the liquidity migration.
Notably, a wallet linked to Ethereum co-founder Joseph Lubin awoke after more than three years of dormancy, mobilizing 80,001 ETH, valued at roughly $122 million.
The massive transfer epitomized the broader trend where long-inactive capital breaks from cold storage to seek out active trading venues and liquid architectures amid the mounting market stress.
Large inflows to trading platforms do not automatically mean investors are selling. They can reflect market-making activity, collateral movement, internal transfers, or portfolio restructuring during periods of stress.
However, traders watch the metric closely because coins held on exchanges are easier to sell or use in derivatives activity than coins sitting in private wallets.
The timing has made the increase harder to dismiss. Ethereum was already trading near $1,580 when the inflows accelerated, while Bitcoin had fallen toward $59,000. That combination suggested investors were moving assets during a marketwide reset rather than during a routine period of repositioning.
If exchange deposits remain elevated, the market could face additional short-term volatility.
Derivatives deleveraging deprives market of rebound capital
The velocity of the current crypto market decline has been accelerated by an extensive deleveraging cycle across leveraged futures platforms.
As spot valuations rapidly deteriorated, automated liquidation engines on major exchanges systematically closed out underwater long positions to protect clearinghouse integrity, amplifying organic selling pressure.
Data analyzed by Santiment illustrates that this liquidation wave effectively flushed out a massive block of speculative capital over a narrow four-day window:
- Bitcoin Total Open Interest: Contracted by approximately 25%, dropping to $23.2 billion, which is its lowest operational aggregate since early April.
- Ethereum Total Open Interest: Decreased by 13%, settling at $9.8 billion, a structural low point not seen since March.
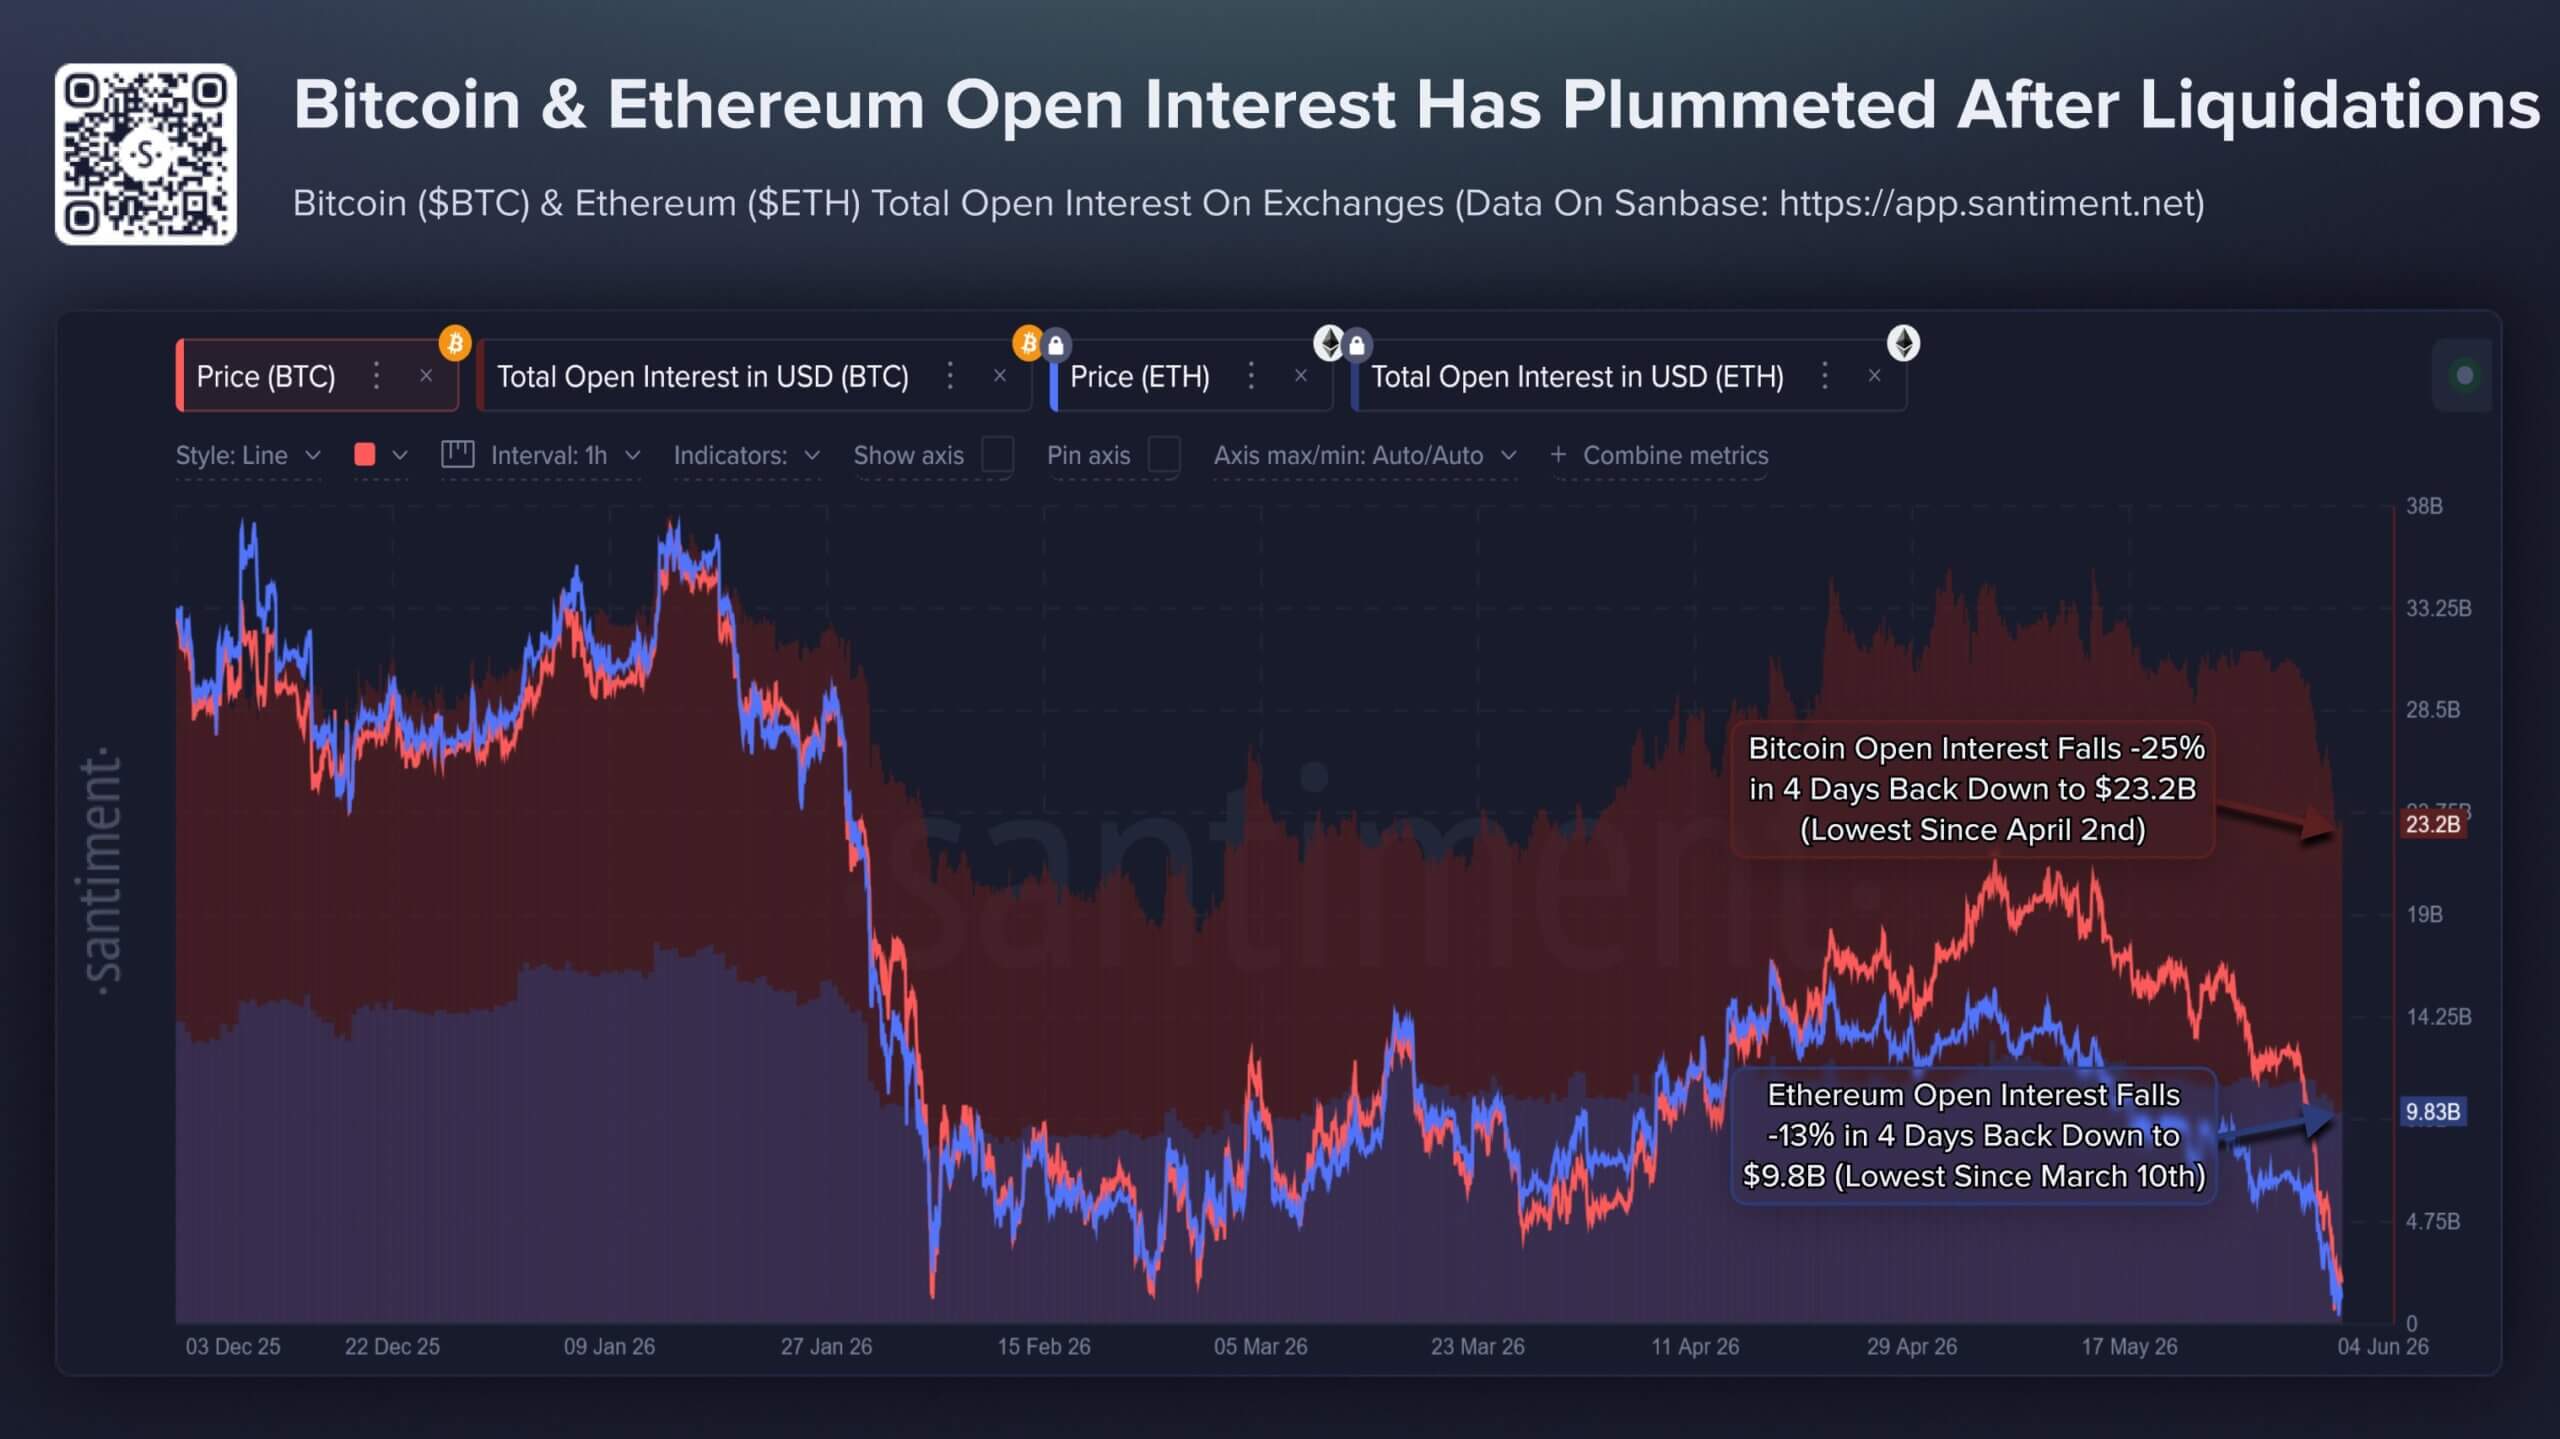
While this aggressive deleveraging leaves the underlying market structurally healthier by purging speculative excess and over-extended margin, it introduces an immediate liquidity vacuum.
The severe drop in open interest demonstrates that the speculative floor has thinned, leaving the market highly vulnerable to further spot pressure due to the lack of immediate leveraged capital available to front-run a classic V-shaped recovery.
Consequently, retail crowd sentiment has cratered to its most pessimistic footing since mid-February.
The firm noted that social metrics reveal an exponential increase in the phraseology of capitulation, with organic social discussions increasingly pairing terms like “Bitcoin” and “altcoins” alongside terminal descriptors such as “dead,” “finished,” “over,” and “ending.”
Traders hedge for a break below $1,500
The buildup of stress across ETFs, exchange flows, whale cost bases, and leveraged markets has shifted attention to ETH’s options market, where traders are paying more to protect against another leg lower.
Deribit data show demand for downside protection has increased sharply. The ETH options put-to-call premium rose to 3.7 times on Friday and has shown consistent excess demand for put options since Monday. Put contracts give holders the right to sell at a set price, making them a common hedge when traders expect further losses or want protection against a disorderly move.
ETH’s open interest has clustered around several downside strikes. Traders have built roughly $108 million in open interest around the $1,500 strike, while the $1,400 strike has attracted about $75 million. The $1,000 strike has drawn about $78 million in positioning.
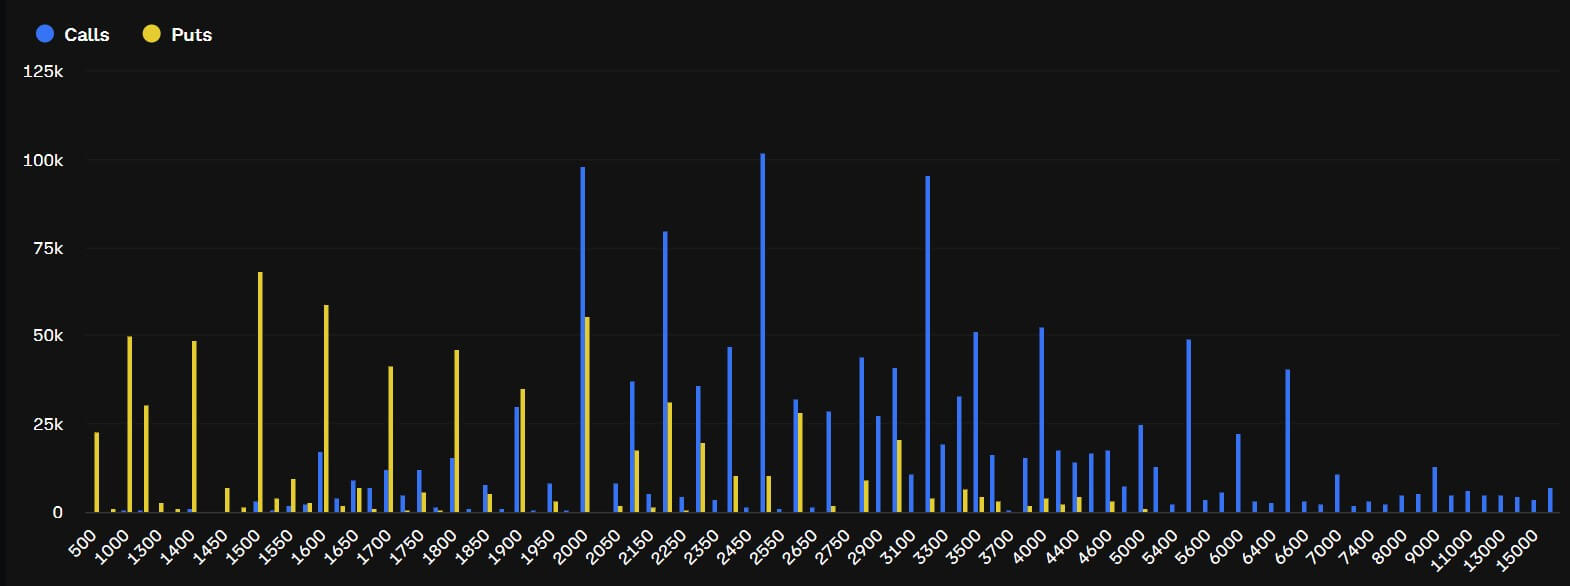
Those levels do not mean the market expects ETH to fall to $1,000 immediately. Instead, they show that traders are paying for protection after several support signals weakened at the same time.
BlockScholes data show the shift has also appeared in volatility pricing. ETH short-dated implied volatility has jumped from a year-to-date low of 36% to 67%, signaling that traders now expect larger near-term price swings.
The move has been accompanied by a sharper skew toward out-of-the-money puts. The seven-day ETH options skew has moved to about -14%, compared with roughly -3% to -4% in late May. Additionally, the demand for puts has also spread across 7-day, 14-day, 30-day, and 90-day maturities.
That broadening shows traders are not just hedging a single event or one short-term move. They are preparing for the possibility that Ethereum’s weakness could extend if ETF outflows continue, exchange inflows stay elevated, and large holders remain below key cost levels.
The next test is whether $1,500 becomes a floor or a trigger. A stabilization in ETF flows and a decline in exchange deposits could help ease pressure.
Without that, the options market’s focus on downside strikes may become the clearest signal of where traders expect the next phase of the selloff to concentrate.
Credit: Source link